The share of renters wrestling with unaffordable housing continues to rise, with nearly half of all renter households now spending more than 30% of their monthly gross income on housing costs, recent data show. Every year, the average cost-burdened household spends nearly $8,000 more on housing than they can afford – meaning above 30% of their monthly gross income – which is nearly the cost of a year’s supply of gas and groceries combined. While the scale of the affordability crisis for renters is well known, less understood is how this burden has shifted over time both by race and geography.
Since 2019, households of color – long disproportionately impacted by affordability challenges – experienced greater increases in spending large shares of their income on housing relative to non-Hispanic white renters. Meanwhile, more low-rent states are now appearing among those with the largest and fastest growing share of renters who spend a large proportion of their income on housing. We examine these trends – observed using data from the Census Bureau’s American Community Survey (ACS) – to explain what they mean for renters who struggle to make ends meet.
Post-Pandemic Trends in Renter Affordability Continue
While the share of renters with moderate cost burdens (defined as spending more than 30% and up to 50% of income on housing) has remained stable in recent years, the share with severe cost burdens (defined as spending more than 50 percent of income on housing) rose to over 26% in 2022. That's 12 million Americans who are annually spending $11,684 more on rent and utilities than they can afford to pay. These increases continue the post-pandemic trend of worsening affordability problems, following a decade of declines in these metrics.
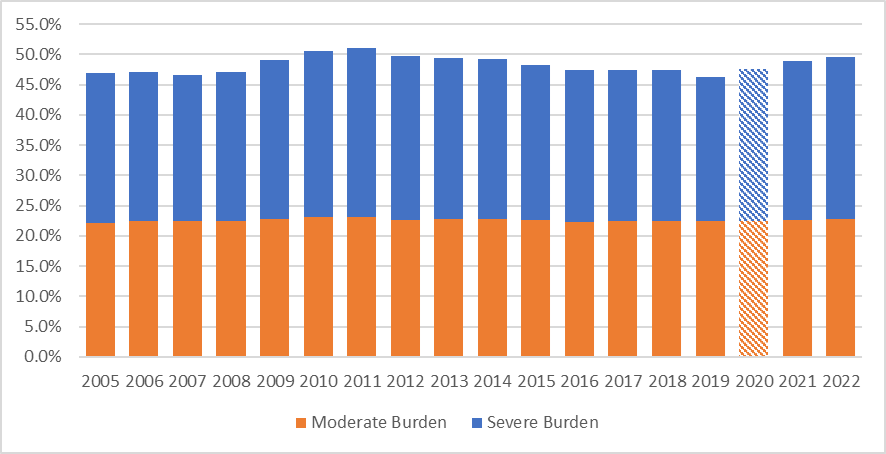
Source: Calculations of 2005-2022 U.S. Census Bureau’s American Community Survey microdata.
Note: Moderate burdens are renters spending more than 30% and up to 50% of their income on housing. Severe burdens are renters spending more than 50% of their income on housing. Data for 2020 is extrapolated due to disruptions in data collection due to the Covid-19 pandemic.
High housing cost burdens are not just a problem for renters but can have trickle-down effects on their local communities. Renters constrained by low incomes and high housing costs have less money remaining to spend on other needs, including food, medical expenses, or childcare – funds that would otherwise go back into their communities to support other households and small businesses.
The Census Bureau’s American Community Survey (ACS) annually samples around 1 out of every 100 households to track conditions across a range of characteristics. The 2022 ACS was released late last year and offers the most in-depth look yet at how renter households are faring following the upheaval of the Covid-19 pandemic. While data from 2020 is not available from the ACS due to interruptions in collections during the pandemic, we can still see a marked shift in affordability relative to pre-pandemic circumstances.

Renters of Color Continue to Face Higher Burdens
Disparities in housing outcomes by race and ethnicity have deep roots in discriminatory policies and practices that prevented many households of color from accessing more desirable housing and neighborhoods, as well as limiting their opportunities for greater wealth and income growth. One consequence of those past actions has long been higher shares of income spent on housing among Black, Indigenous, and other people of color (BIPOC), especially those that rent. Non-Hispanic Black renters in particular bear the brunt of unaffordable housing, with more than 30% of them experiencing severe cost burdens in every year but one since 2005. In contrast, no more than a quarter of non-Hispanic white renters have ever had severe cost burdens over that time frame.
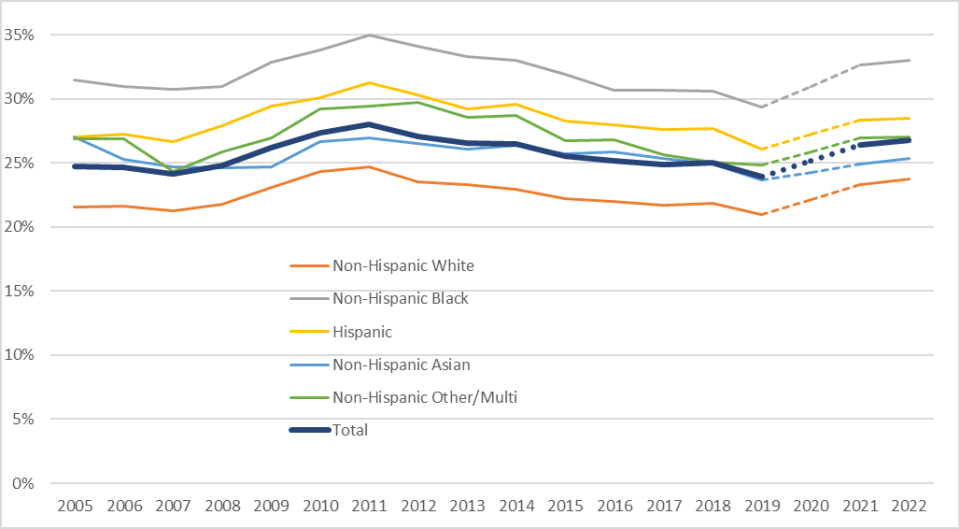
Source: Calculations of 2005-2022 U.S. Census Bureau’s American Community Survey microdata.
Note: Severe burdens are renters spending more than 50% of their income on housing. Data for 2020 is extrapolated due to disruptions in data collection due to the Covid-19 pandemic.
Not only are these differences in renter affordability by race and ethnicity stark, but they have increased since the Covid-19 pandemic, with the share of severely burdened non-Hispanic Black renters increasing by 3.7%, while the share of similarly burdened non-Hispanic White renters rose by 2.8%. Other racial/ethnic groups – including Hispanics and non-Hispanic Asians and other/multi-race households – saw comparably smaller growth in severely cost-burdened renters, though their total shares remain noticeably elevated.
More States Report Low Renter Affordability
When renters face high housing costs in their state or metro area, many may move to what they perceive as more affordable parts of the country. However, income levels can be lower too, so shares of income spent on housing in these locations may not be materially better, especially if residual income available after paying for housing is also reduced.
Comparing rental cost burdens by state lend some support this theory; while there is a moderate correlation (47.7%) between high-rent and high cost-burden states, there are many notable exceptions. For example, Washington D.C. had the second-highest rents in the country in 2022 but was ranked 27th in severe cost burden share (25% and below the national rate). Meanwhile, Louisiana had the sixth highest share of severely cost burdened renters, at 29% - only two percentage points less than in Florida despite a nearly 40% lower median rent ($920 per month).
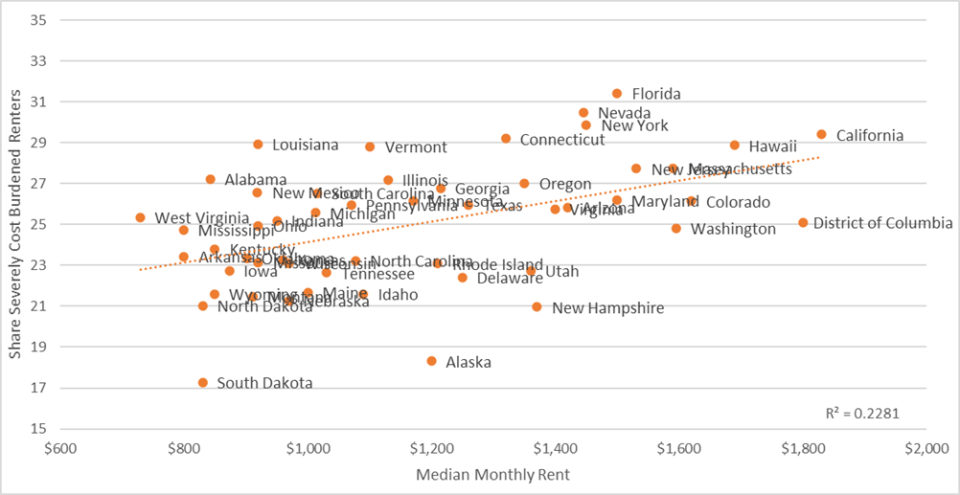
Source: Calculations of 2005-2022 U.S. Census Bureau’s American Community Survey microdata.
Note: Severe burdens are renters spending more than 50% of their income on housing.
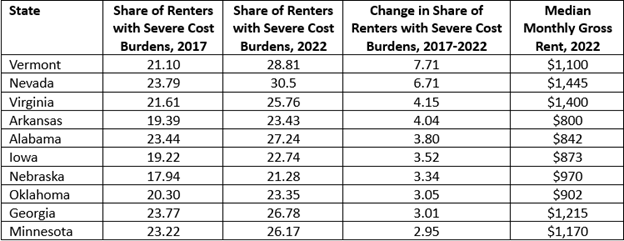
Looking at changes in cost burdens over time also shows how lower-cost states have become less affordable in recent years. Among the top ten states with the largest increases in share of severely cost-burdened renters between 2017 and 2022, all but two had a median monthly rent in 2022 that is below the national median of $1250.
Moving to affordability thus is no longer an option for many renters, as rising housing costs everywhere outpace income growth. It is only with substantial increases in housing supply—particularly at affordable price points--and critical subsidies to support the lowest-income households that renters may find relief.
